
We here at Cornerstone Information Systems have been working on a method to aggregate, anonymize, and distribute information about the health of the Travel Industry – gathered from all of the data that flows through our network every month. We feel that, especially in light of the recent crises, it is paramount that companies with data share our knowledge and the foresight it brings so that we might not experience a repeat of the crash that accompanied the emergence of COVID.
To facilitate that goal of data sharing, and yet also keep the data of our clients private, we have been working on the creation of a Cornerstone Index.
Work on this project is still in progress, but we wanted to share with you our biggest numbers coming out of the Index regarding July 2021:
| Avg Trip Spend | $1338.76 | |||
| Avg Air Spend | $550.09 | |||
| Avg Hotel Spend | $520.72 | |||
| Avg Car Rental Spend | $267.76 |
There was also a 5% increase in processed trips taken from June 2021 to July 2021.
** All currency is displayed in USD – the aggregates of our data have been converted into USD before being taken into account and calculating the Index numbers **
NEW: Total volume of trips processed by Cornerstone in 2021
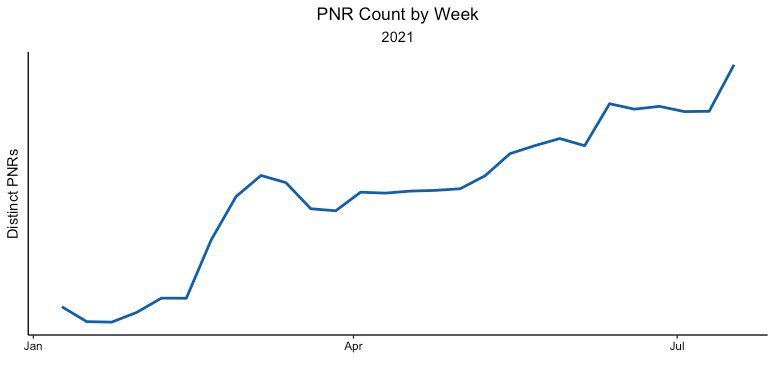
July 2021 Analysis
- Growth for total processed trips slowed, and we believe the biggest culprit is the delta variant of COVID-19. As the delta variant spreads, businesses are contracting their travel plans and efforts. This is unfortunate, but not surprising. We were still pleased to see some growth despite this new development.
- Price fluctuations were more stable than last month, with a virtual zero change in car rental spend in particular. Whether one calls it “stabilization” or “plateauing”, however, depends on your outlook. We will remain cautious in our own predictions as the delta variant has proven unpredictable.
- For the second month in a row, total trips processed by Cornerstone are higher than they have ever been during the COVID era. We are still at 50% of the trips processed in February of 2020, but this is on par with IATA’s predictions for the year to remain at 53% of 2020 travel.*
* https://www.travelweekly.com/Travel-News/Airline-News/IATA-air-traffic-forecast
Information on the Cornerstone Index:
Much like how the S&P 500 Index tells the health of the US Stock Market, so the Cornerstone Index is meant to reflect the health of the travel industry according to the data that we have available to us.
Please note that we are performing adjustments and cleansing to ensure an accurate index. This means that during our development of the index, some values may fluctuate month to month in their calculations. However, we do not believe this offsets major trends.
In the future, this will become an interactive app closely resembling our TravelOptix platform. At that time, we will be including functionality for different currencies. We are welcoming any feedback regarding this idea, and look forward to providing this information going forward.