
We here at Cornerstone Information Systems have been working on a method to aggregate, anonymize, and distribute information about the health of the Travel Industry – gathered from all of the data that flows through our network every month. We feel that, especially in light of the recent crises, it is paramount that companies with data share our knowledge and the foresight it brings so that we might not experience a repeat of the crash that accompanied the emergence of COVID.
To facilitate that goal of data sharing, and yet also keep the data of our clients privacy, we have been working on the creation of a Cornerstone Index.
Work on this project is still in progress, but we wanted to share with you our biggest numbers coming out of the Index regarding April 2021:
| Avg Trip Spend | $1255.89 | |||
| Avg Air Spend | $470.82 | |||
| Avg Hotel Spend | $550.72* | |||
| Avg Car Rental Spend | $234.35 |
There was also a 4% decrease in processed trips taken from March 2021 to April 2021.
** All currency is displayed in USD – the aggregates of our data have been converted into USD before being taken into account and calculating the Index numbers **
NEW: Total volume of trips processed by Cornerstone year-over-year
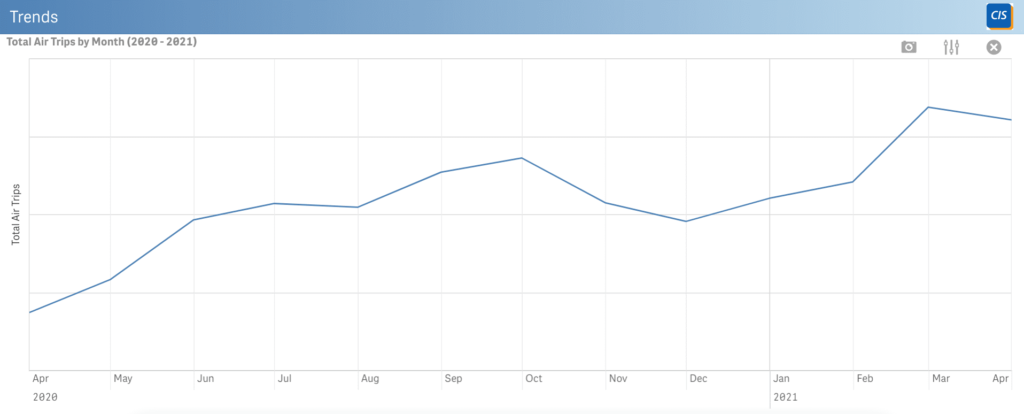
April 2021 Analysis
- March remains the highest for total trips taken since the pandemic began, but April was not very far behind. There is definitely some up-and-down going on, and we have seen this on other metrics that we are looking at as well. But overall, the directionality is upward.
- Last month, we changed our reporting in how we showcase a different number from now on for hotel spend. Hotel spend used to be averaged per night, but will now be reported as average spend per trip. This will reflect more accurate data as it also accounts for how long trips are becoming. For April 2021, hotel nights per trip averaged 4.41.
- The implementation of vaccines is likely the biggest reason for the massive boost in overall numbers of trips taken in March 2021 and for the stability in April. We had expected the upward trend to continue, but it might instead be proof of stability in confidence. We will continue to keep a very close eye on this trend.
Information on the Cornerstone Index:
Much like how the S&P 500 Index tells the health of the US Stock Market, the Cornerstone Index is meant to reflect the health of the travel industry according to the data that we have available to us.
Please note that we are performing adjustments and cleansing to ensure an accurate index. This means that during our development of the index, some values may fluctuate month to month in their calculations. However, we do not believe this offsets major trends.
In the future, this will become an interactive app closely resembling our TravelOptix platform. At that time, we will be including functionality for different currencies. We are welcoming any feedback regarding this idea, and look forward to providing this information going forward.