We here at Cornerstone Information Systems have been working on a method to aggregate, anonymize, and distribute information about the health of the Travel Industry – gathered from all of the data that flows through our network every month. We feel that, especially in light of the recent crises, it is paramount that companies with data share our knowledge and the foresight it brings so that we might not experience a repeat of the crash that accompanied the emergence of COVID.
To facilitate that goal of data sharing, and yet also keep the data of our clients private, we have been working on the creation of a Cornerstone Index.
Work on this project is still in progress, but we wanted to share with you our biggest numbers coming out of the Index regarding June 2021:
| Avg Trip Spend | $1238.91 | |||
| Avg Air Spend | $512.78 | |||
| Avg Hotel Spend | $470.69* | |||
| Avg Car Rental Spend | $255.44 |
There was also a 15% increase in processed trips taken from May 2021 to June 2021.
** All currency is displayed in USD – the aggregates of our data have been converted into USD before being taken into account and calculating the Index numbers **
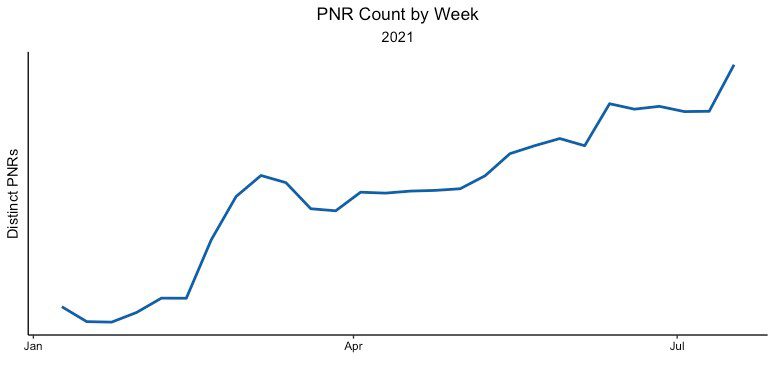
NEW: Total volume of trips processed by Cornerstone in 2021
June 2021 Analysis
- With +15% increase in processed trips, Cornerstone is finally showing the same number of trips being taken in May 2021 as there were in March 2020. While that isn’t yet “back to normal”, March 2020 WAS the last month in which we saw any “normal” travel behavior as the pandemic only kicked into full swing mid-month.
- We also saw slight fluctuations for car and hotel for the month of June, though not by a huge margin. Costs wavering by +/- 5% do not represent huge dips or raises in the overall market. (This month, the +4.9% in the car spend represents only a $12 increase). The 11% dip in air spend is a significant change, and one that we will keep an eye on as the recovery moves forward.
- Total travel increases for the 6 month period of Jan 2021 – Jun 2021 is at +74.8% for trips processed by Cornerstone. If we look at the month-to-month increase, it averages out to +15% per month for 2021. Hopefully the recovery will soon take on an exponential growth, but if it continues at this linear rate, we wouldn’t see Feb 2020 travel volume until August 2022.
Information on the Cornerstone Index:
Much like how the S&P 500 Index tells the health of the US Stock Market, so the Cornerstone Index is meant to reflect the health of the travel industry according to the data that we have available to us.
Please note that we are performing adjustments and cleansing to ensure an accurate index. This means that during our development of the index, some values may fluctuate month to month in their calculations. However, we do not believe this offsets major trends.
In the future, this will become an interactive app closely resembling our TravelOptix platform. At that time, we will be including functionality for different currencies. We are welcoming any feedback regarding this idea, and look forward to providing this information going forward.